 1
 2
 3
 4
 5
 6
 7
 8
 9
10
11
12
13
14
15
16
17
18
19
20
21
22
23
24
25
26
27
28
29
30
31
32
33
34
35
36
37
38
39
40
41
42
43
44
45
46
47
48
49
50
51
52
53
54
55
56
57
58
59
60
61
62
63
64
65
66
67
68
69
70
71
72
73
|
# -*- coding: utf-8 -*-
#-------------------------------------------------------------------------------
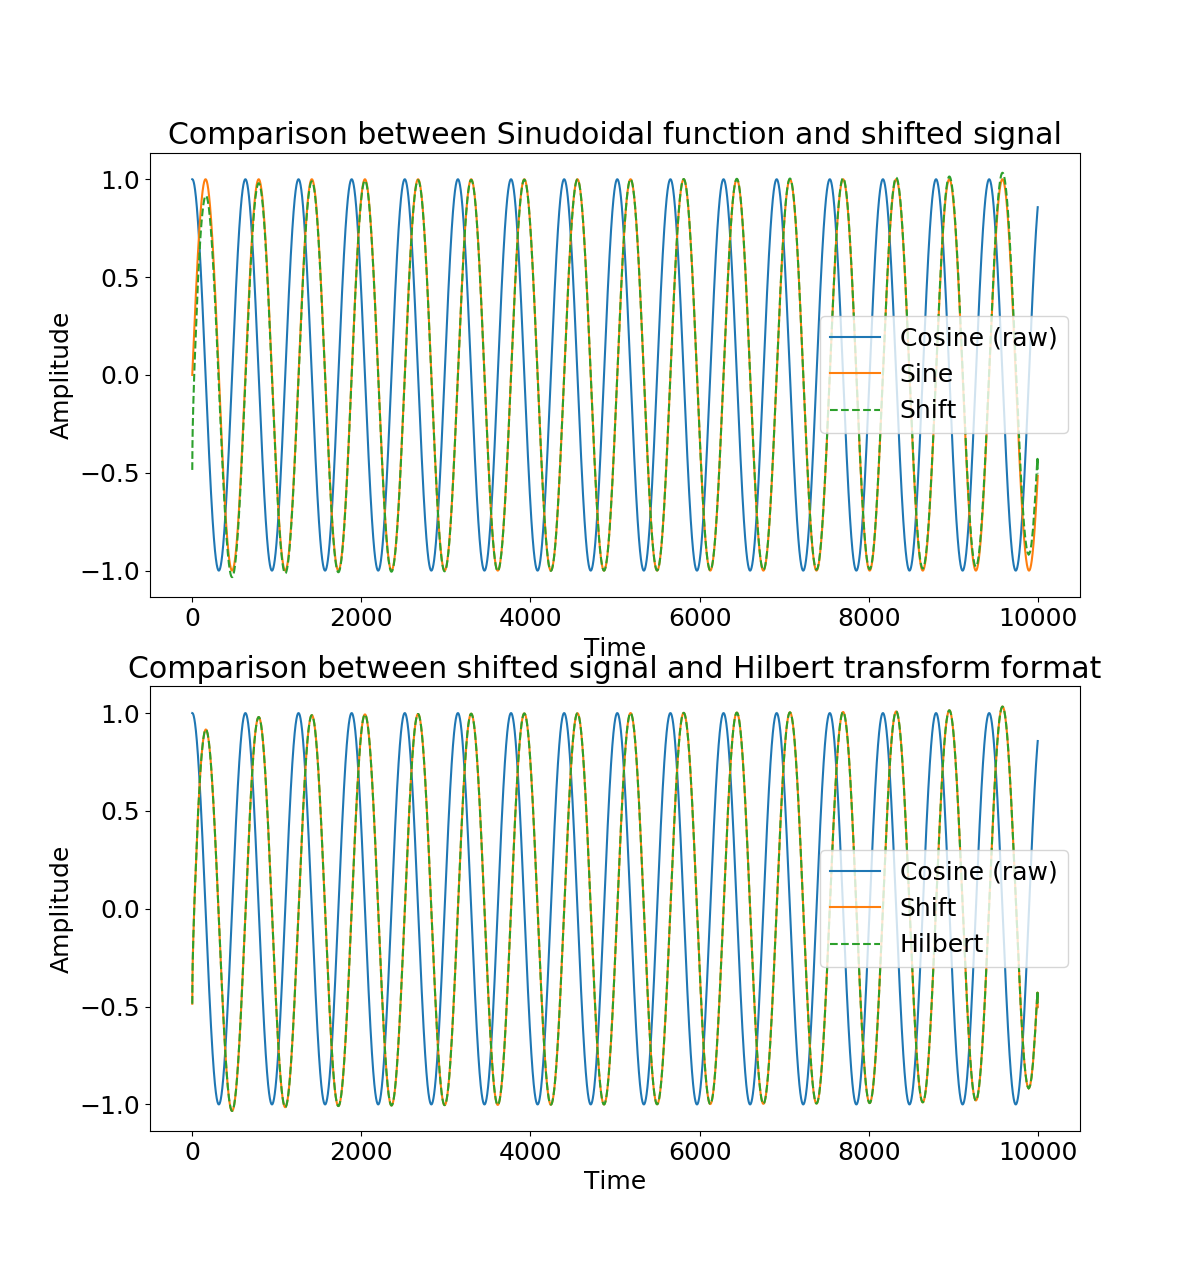
# Purpose: Shown edge error in performing phase shift
# Status: Developing
# Dependence: Python 3.6
# Version: ALPHA
# Created Date: 22:11h, 29/07/2018
# Usage: python test.py
# Author: Xiao Xiao, https://github.com/SeisPider
# Email: xiaox.seis@gmail.com
# Copyright (C) 2017-2018 Xiao Xiao
#-------------------------------------------------------------------------------
from numpy.fft import rfft, irfft, rfftfreq
from scipy.signal import hilbert
import numpy as np
import matplotlib.pyplot as plt
import matplotlib
font = {'size' : 18}
matplotlib.rc('font', **font)
def phase_shift(iptsignal, angle, dt):
"""Perform phase shift of arbitary angle
Parameter
=========
iptsignal : numpy.array
input signal
angle : float
angle to shift signal, in degree
dt : float
time step
"""
# Resolve the signal's fourier spectrum
spec = rfft(iptsignal)
freq = rfftfreq(iptsignal.size, d=dt)
# Perform phase shift in freqeuency domain
spec *= np.exp(1.0j * np.deg2rad(angle))
# Inverse FFT back to time domain
phaseshift = irfft(spec, n=len(iptsignal))
return phaseshift
if __name__ == '__main__':
# Define Time range
time = np.arange(0, 10000)
signal = np.cos(time / 100.0)
sinsignal = np.sin(time / 100.0)
# Shift angle and time step
angle, dt = -90, 1
phsignal = phase_shift(signal, angle, dt)
# Comparasion between Personal shifted and theoretical result
fig, axes = plt.subplots(nrows=2, ncols=1, figsize=(12, 14))
axes[0].plot(time, signal, label="Cosine (raw)")
axes[0].plot(time, sinsignal, label="Sine")
axes[0].plot(time, phsignal, "--", label="Shift")
axes[0].set_xlabel("Time")
axes[0].set_ylabel("Amplitude")
axes[0].set_title("Comparison between Sinudoidal function and shifted signal")
axes[0].legend()
# Comparasion between Personal shifted and Hilbert transform result
axes[1].plot(time, signal, label="Cosine (raw)")
axes[1].plot(time, phsignal, label="Shift")
axes[1].plot(time, np.imag(hilbert(signal)), "--", label="Hilbert")
axes[1].set_xlabel("Time")
axes[1].set_ylabel("Amplitude")
axes[1].set_title("Comparison between shifted signal and Hilbert transform format")
axes[1].legend()
plt.show()
|